
Bitcoin's Diminishing Monthly Returns - A Decade Ahead
Over the past 15 years, Bitcoin has repeated one of the most recognizable rhythms in modern finance, a 4-year cycle of expansion and retracement.
The structure has remained consistent: three years of bull market, followed by one year of correction.
This visualization explores what could happen if that rhythm continues, but with diminishing monthly returns as adoption and market maturity gradually slow the pace of growth.
The Model
The chart extends Bitcoin’s historical 4-year rhythm into the coming decade, based on a simple principle:
- 3 years of bull market, followed by 1 year of retracement
- Each new cycle grows at a lower average monthly rate
- The overall trend remains upward, but with smoother, more measured expansions
Rather than forecasting exact prices, this model illustrates how monthly returns decline exponentially as adoption saturates, a natural outcome for every maturing asset class.
The Chart - Base Case (include_all) - Treating Early Cycles Equally
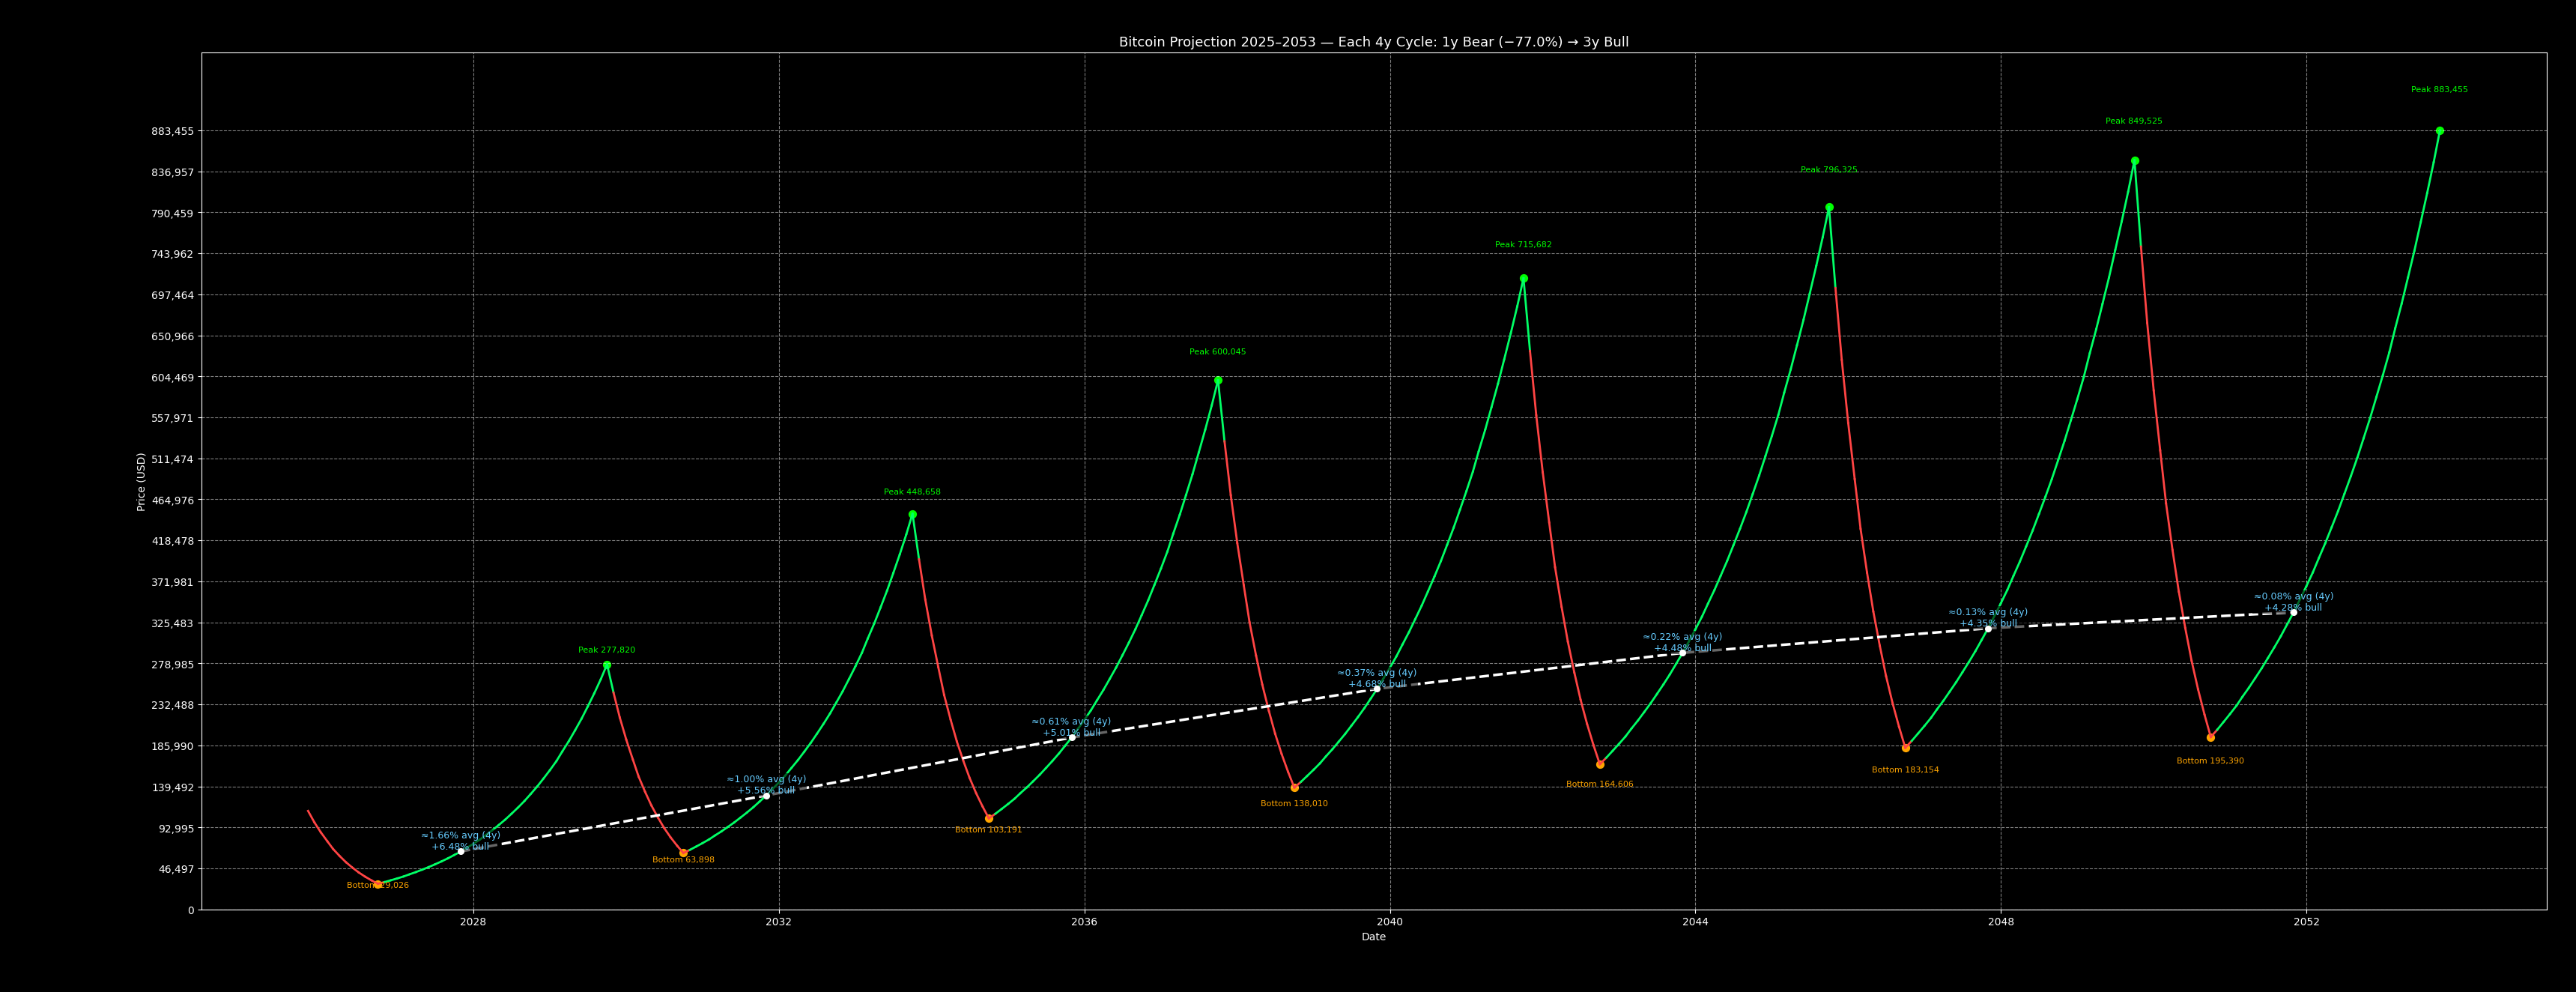
This version fits the log-linear regression using all four historical cycles (1–4), giving equal weight to the early exponential phase.
- Produces a natural long-term growth estimates
- Reflects a world where early-stage volatility remains part of Bitcoin’s DNA
- Useful as an optimistic adoption scenario
Alternative Scenarios
To explore how different statistical fits might shift the long-term curve, two additional versions are included below.
1. Exclude First
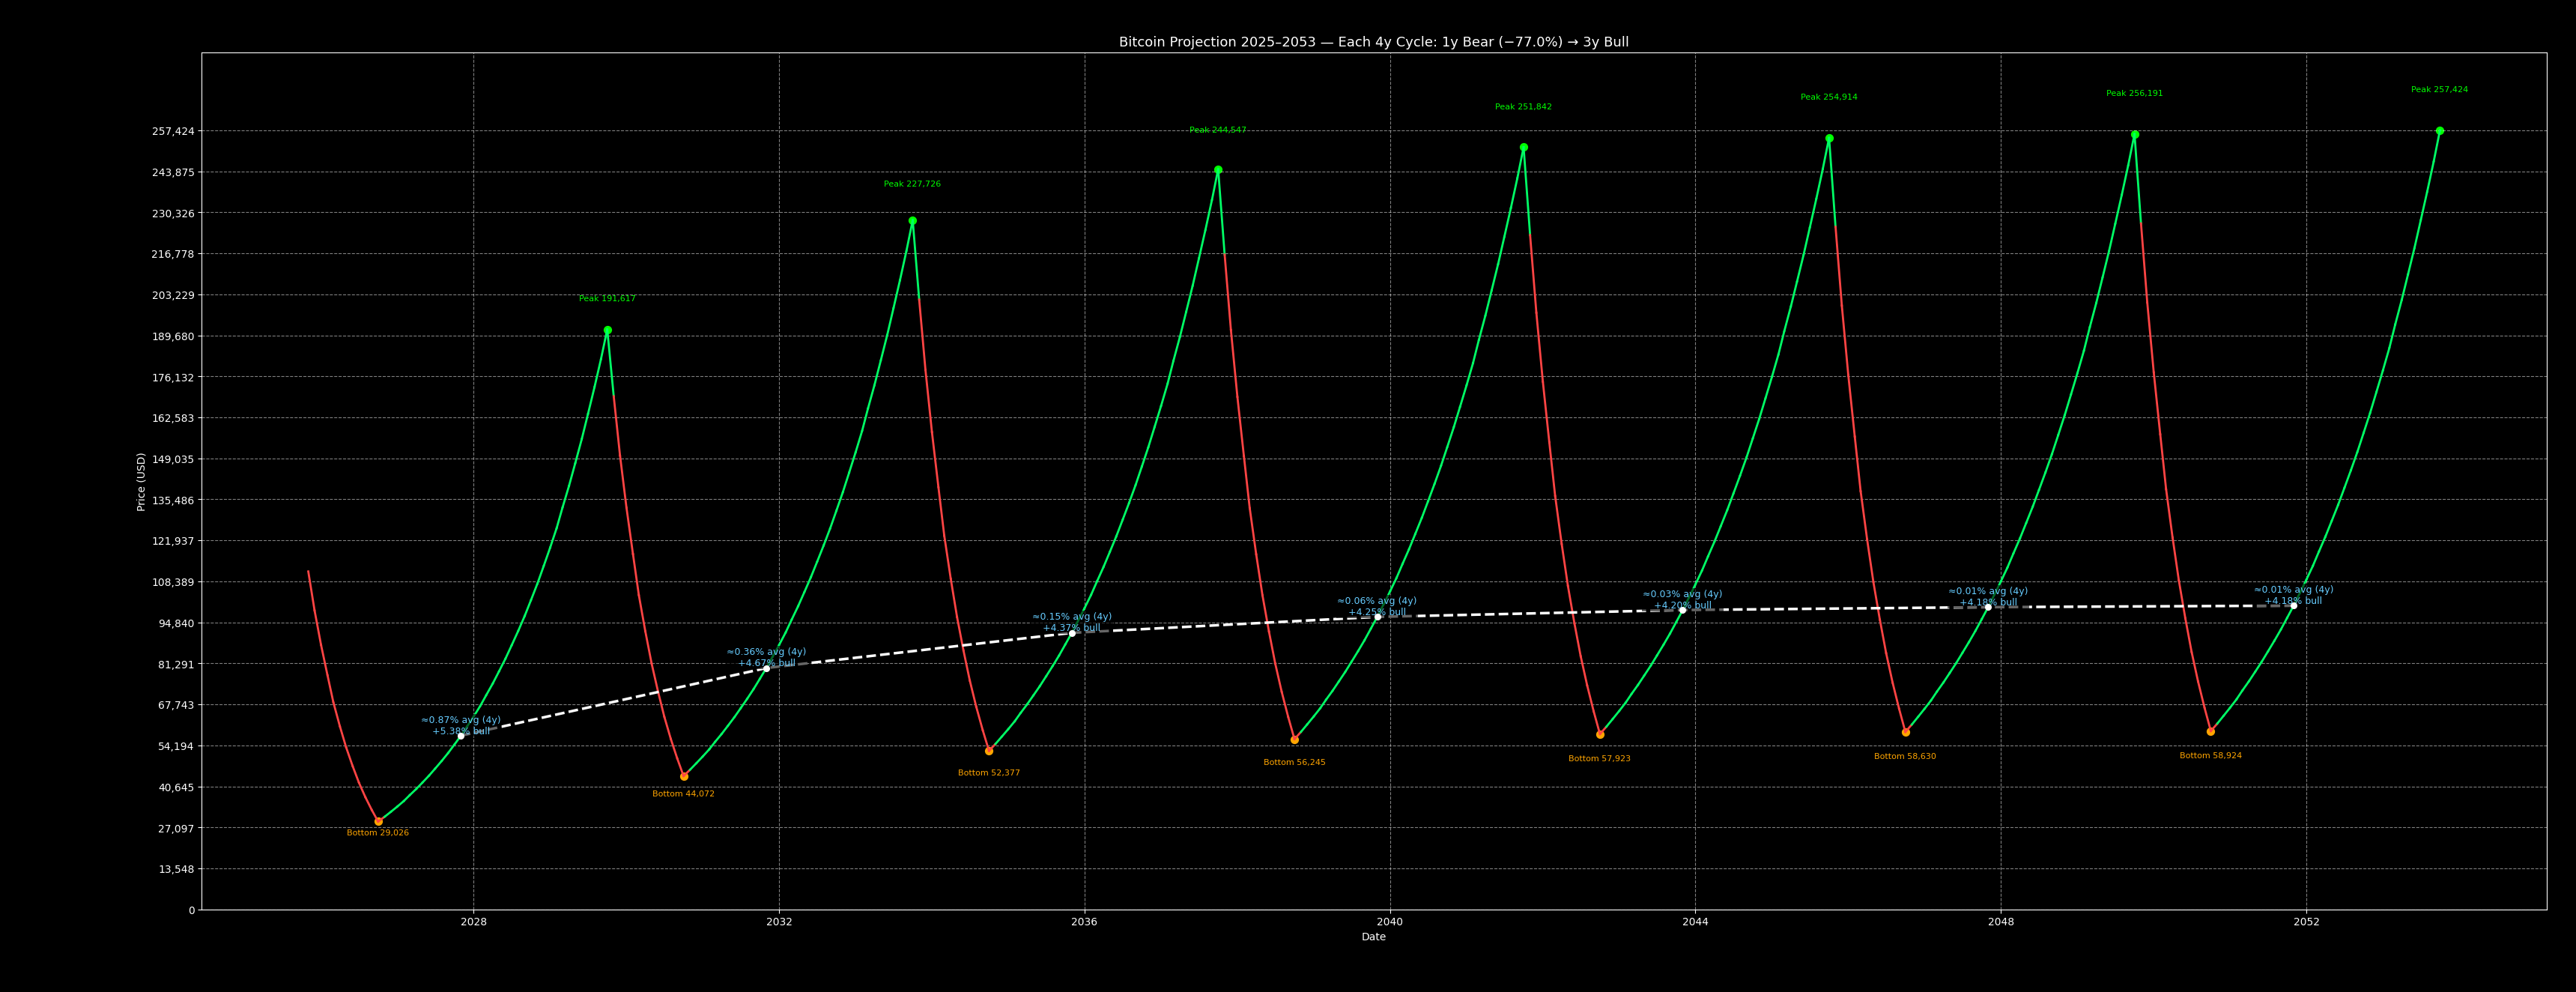
This is the exclude first cycle scenario, fitted using the log-linear regression of cycles 2–4 only - effectively excluding the explosive early cycle (2010–2013), to better reflect Bitcoin’s post-institutional era dynamics.
Each green segment represents a bull phase, while red marks a retracement year.
The dashed white line connects the midpoints of each 4-year cycle, highlighting the structural growth trajectory - the long arc of Bitcoin’s adoption curve.
This version assumes that early-cycle hypergrowth was an anomaly and that modern cycles follow a smoother exponential decay.
2. Weighted - Reducing Early-Cycle Influence
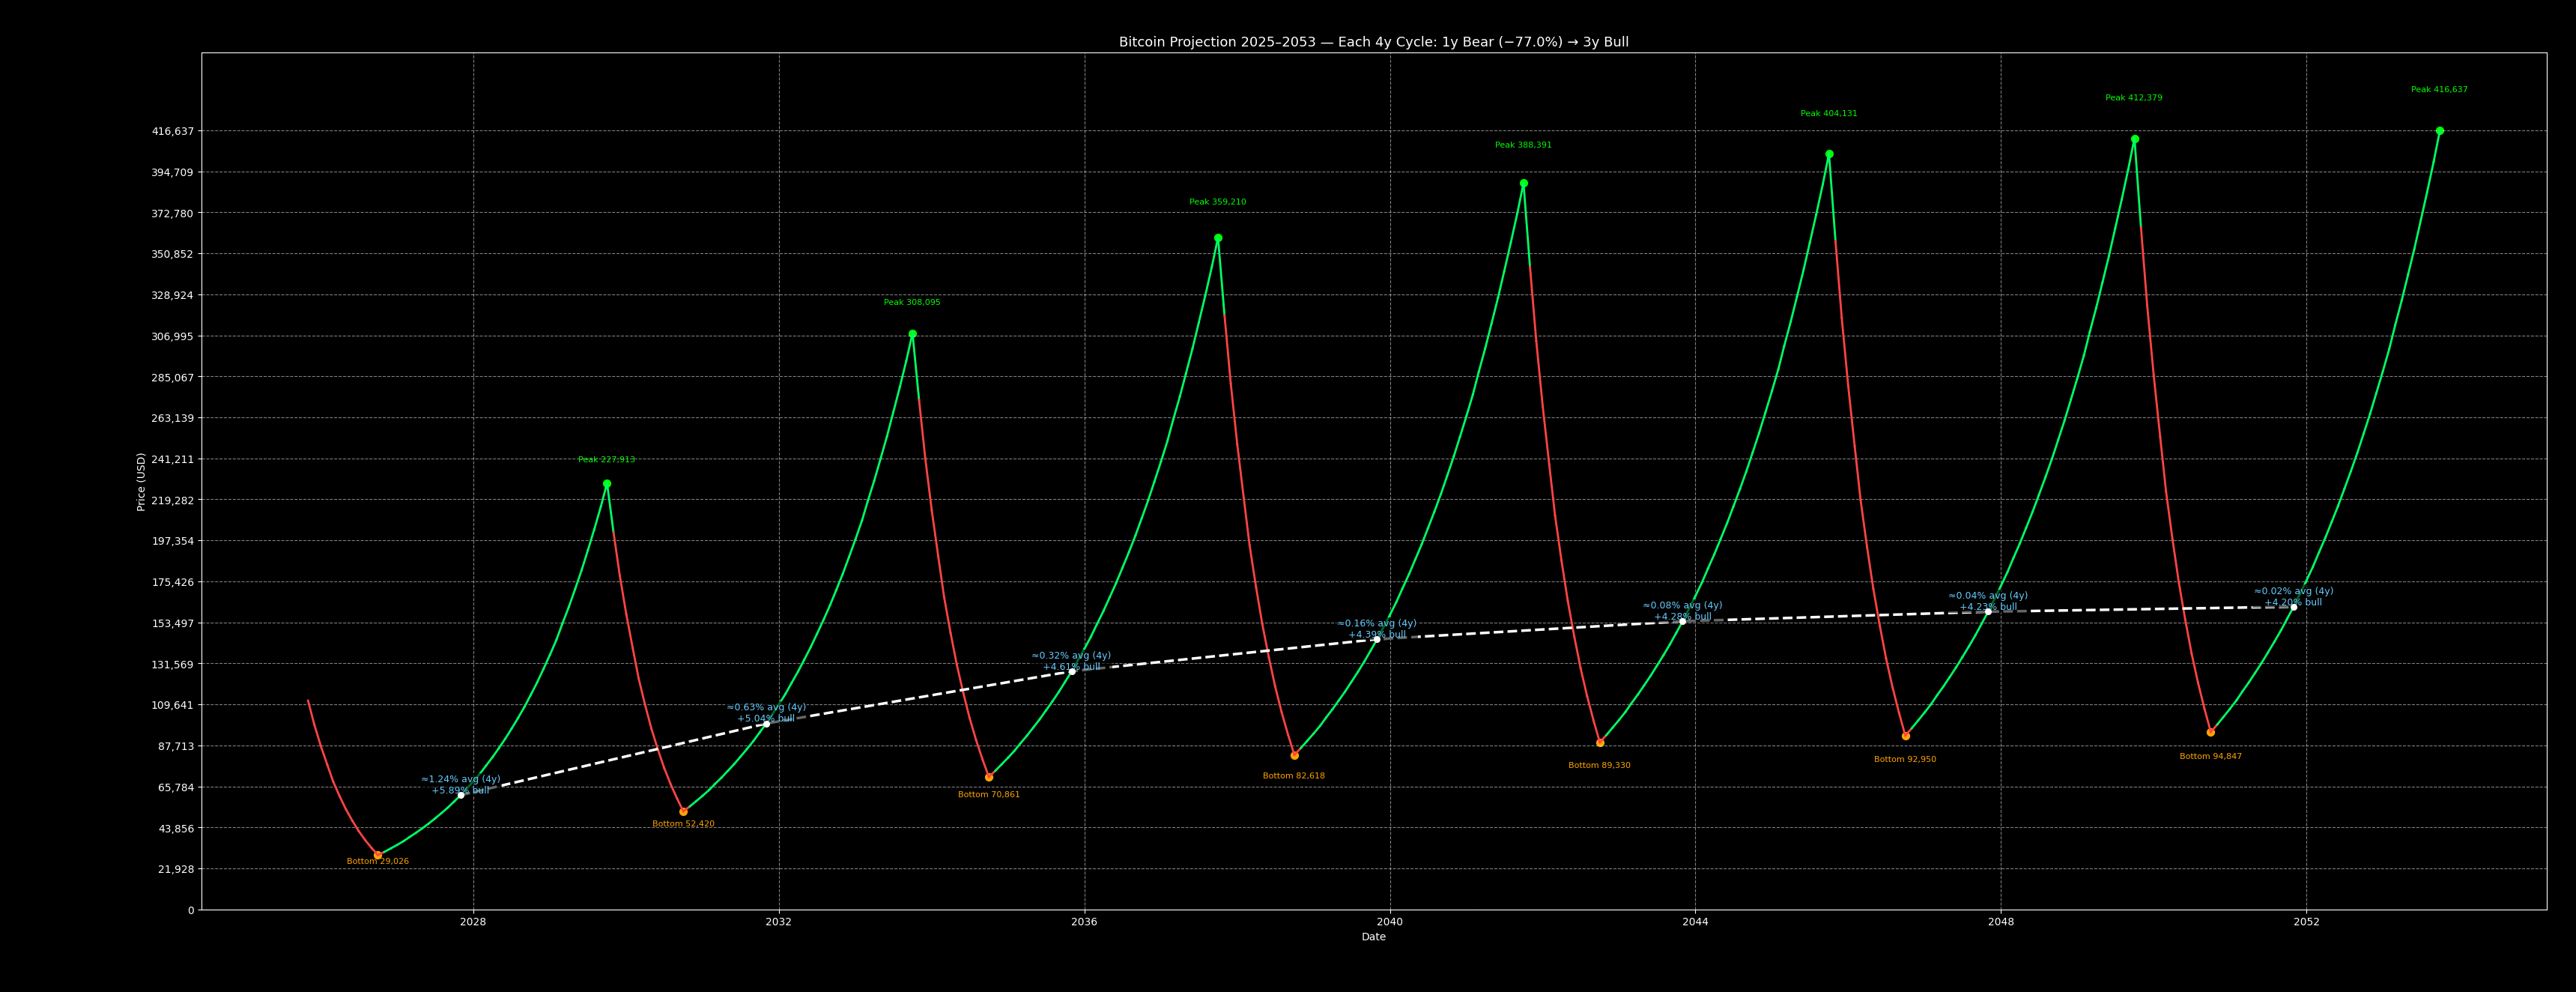
This version applies progressive weighting to historical cycles, heavily discounting the first one, while still acknowledging its influence.
- Smooths out early noise, without ignoring it completely
- Serves as a balanced “institutional continuity” scenario
- Fits best if Bitcoin continues growing but with diminishing speculative blow-offs
Interpretation
The takeaway isn’t about pinpointing Bitcoin’s next peak, but about understanding the shape of diminishing momentum over time.
Future expansions may still be powerful, just less explosive and more aligned with the slower compounding of a mature, globally integrated market.
Volatility and the amplitude of growth are directly proportional to the depth of the preceding correction.
In other words, deep bear markets reset volatility - and make the next expansion possible.
Source code
For those who wish to reproduce or experiment with the model, I have made the full source code available on GitHub:
https://github.com/avra911/BDRT
This repository includes:
- the log-linear regression method used to estimate diminishing monthly cycle returns,
- the cycle fitting options (
exclude_first,include_all,weighted), - the forward scenario projection framework,
- and the plotting & visualization utilities.
You are welcome to analyze, adapt, or extend the model, provided attribution is preserved.
Disclaimer
This model is provided strictly for research and educational purposes.
It is a way to visualize how Bitcoin’s long-term return profile has evolved historically under diminishing returns.
It does not predict short-term price action, does not guarantee future outcomes and should not be used as a standalone trading signal.
Markets are dynamic. Liquidity regimes change. Structural behavior can shift.
Any scenario presented here should be understood as one possible interpretation, not a certainty or investment directive.
IMPORTANT: The Role of Illiquid Supply
If Satoshi’s ~1M BTC represents dead supply (coins that will never return to market) and if institutional accumulators like Michael Saylor continue locking up illiquid supply (coins that are removed from trading circulation), then the structure of Bitcoin price cycles is no longer defined solely by diminishing returns.
Instead, the dominant force becomes supply compression.
When the free-float supply decreases, price does not rise slowly in a smooth curve. It reprices vertically - suddenly, violently and with very little warning.
This means:
- The early “adoption-driven exponential growth” phase has mostly played out.
- The next era is defined by scarcity shocks, not speculative exuberance.
- Peaks may become sharper, faster and less frequent.
If more long-horizon holders (“fighters of the light,” so to speak) accumulate and consistently refuse to sell, the available supply becomes even thinner.
In such an environment, small increases in demand can trigger outsized price moves.
This does not invalidate diminishing returns - it evolves the model:
Diminishing Returns (cycle 2 → 3 → 4) → Supply Compression (cycle 5 → 6 → 7+)
In other words:
- The growth engine of Bitcoin shifts
- From risk premium to scarcity premium.
“Cycles define the rhythm, adoption defines the slope, and time smooths them both."
